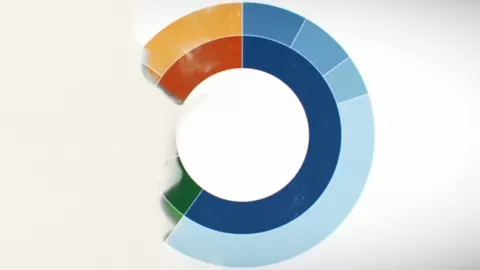
Disclosure: when you buy through links on our site, we may earn an affiliate commission.

Plotting with Seaborn for Beginners in Data Science

Python Plotting with Seaborn for Beginners in Data Science, Machine Learning and Deep Learning
4.7
4.7/5
(28 reviews)
9,441 students
Created by

8.3

CourseMarks Score®

8.2

Freshness

8.4

Feedback

7.8

Content

Platform: Udemy
Video: 3h 39m
Language: English
Next start: On Demand

Top Data Visualization courses:

Detailed Analysis

CourseMarks Score®

8.3 / 10

CourseMarks Score® helps students to find the best classes. We aggregate 18 factors, including freshness, student feedback and content diversity.

Freshness Score

8.2 / 10
This course was last updated on 11/2020.

Course content can become outdated quite quickly. After analysing 71,530 courses, we found that the highest rated courses are updated every year. If a course has not been updated for more than 2 years, you should carefully evaluate the course before enrolling.

Student Feedback

8.4 / 10
We analyzed factors such as the rating (4.7/5) and the ratio between the number of reviews and the number of students, which is a great signal of student commitment.

New courses are hard to evaluate because there are no or just a few student ratings, but Student Feedback Score helps you find great courses even with fewer reviews.

Content Score

7.8 / 10
Video Score: 8.1 / 10
The course includes 3h 39m video content. Courses with more videos usually have a higher average rating. We have found that the sweet spot is 16 hours of video, which is long enough to teach a topic comprehensively, but not overwhelming. Courses over 16 hours of video gets the maximum score.
The average video length is 5 hours 08 minutes of 163 Data Visualization courses on Udemy.
Detail Score: 9.8 / 10

The top online course contains a detailed description of the course, what you will learn and also a detailed description about the instructor.

Extra Content Score: 5.5 / 10

Tests, exercises, articles and other resources help students to better understand and deepen their understanding of the topic.

This course contains:

0 article.
0 resource.
0 exercise.
0 test.

Table of contents

Description

What is Seaborn ?
Seaborn is a statistics library used to create stunning visualizations for statistical data. It is built on top of Matplotlib and very closely integrates with pandas Dataframes. If you want great publication quality graphs on statistical data with minimum coding, this is the library for you.

I already know Matplotlib. Do I need Seaborn ?
While Matplotlib is the beginner’s toolkit to create plots & Visualizations in Data science for Python, it has its limitations. This is where Seaborn shines, with its publication quality graphics and advanced visualization aspects that will enable you to create stunning quality graphics with very minimal code. All of this with much smaller syntax compared to Matplotlib.

How different is Seaborn from Matplotlib ?
•Matplotlib is limited to basic plotting and its visualization consists of just the core elements of plotting like barcharts, scatter plots and so on. Seaborn on the other hand can do a great deal of visualization and has in-built tools for most of the advanced Data Scientist requirements.
•While Matplotlib is closely modelled from MATLAB (another great but proprietary tool), Seaborn is built from the ground up to be an easy to use tool, leaving behind the legacy inadequacies of Matplotlib.
•While Matplotlib can work easily with both Pandas Data frames and Numpy Arrays, Seaborn is specifically built to handle Data Frames easily. Seaborn has a much more intuitive API to handle Dataframes.
•While Matplotlib provides the most flexibility, Seaborn lets you up and running fast with the mostly used default options.
I know nothing about data visualization, can I still take this course?
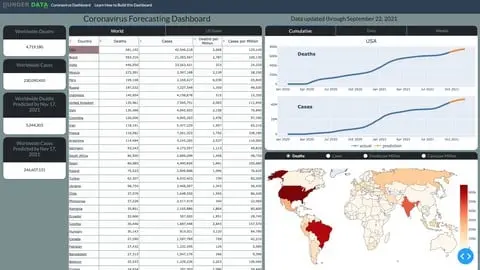
Data visualization tools are used to analyse, format and publish the data. This data is used in statistical analysis, research, health care, social media analysis etc.,
Matplotlib is a data visualization library in Python on which other libraries like Seaborn are built.
Having a good understanding of Matplotlib helps you learning the other libraries quickly. I suggest you first take my course  ‘Matplotlib Tutorial’ which presents you with various examples in order to get comfortable with the different forms of plots and interfaces of Matplotlib and then learn Seaborn so that you have good foundation.

You will learn

✓ Get up and going with plots and graphs in Seaborn. Learn how to create stunning visualizations in Seaborn (No, can’t do these in Matplotlib). Leverage your Matplotlib skills to upgrade to the shiniest tool in Python’s most sophisticated plotting toolkit. Learn all about all the latest and greatest plots available in Seaborn. Master the Seaborn API. Create publication quality plots and graphs using Seaborn.

Requirements

• Just a good PC or Mac with decent internet connection. Of course a will to learn. Basic knowledge of the Matplotlib library.

This course is for

• Students who already have a basic understanding of the Matplotlib library and are looking to upgrade their skills then this is the right course for you.
• Students who are looking to learn data visualization using Python can check out my course on udemy: Matplotlib Tutorial.

How much does the Plotting with Seaborn for Beginners in Data Science course cost? Is it worth it?

The course costs $14.99. And currently there is a 70% discount on the original price of the course, which was $19.99. So you save $5 if you enroll the course now.
The average price is $16.0 of 163 Data Visualization courses. So this course is 6% cheaper than the average Data Visualization course on Udemy.

Does the Plotting with Seaborn for Beginners in Data Science course have a money back guarantee or refund policy?

YES, Plotting with Seaborn for Beginners in Data Science has a 30-day money back guarantee. The 30-day refund policy is designed to allow students to study without risk.

Are there any SCHOLARSHIPS for this course?

Currently we could not find a scholarship for the Plotting with Seaborn for Beginners in Data Science course, but there is a $5 discount from the original price ($19.99). So the current price is just $14.99.

Who is the instructor? Is Ajay Tech a SCAM or a TRUSTED instructor?

Ajay Tech has created 7 courses that got 6,193 reviews which are generally positive. Ajay Tech has taught 231,850 students and received a 4.3 average review out of 6,193 reviews. Depending on the information available, Ajay Tech is a TRUSTED instructor.
Data Science and Machine Learning for everybody
Ajay Tech is an IT Training company, focused on Data Science, Machine Learning, Deep Learning and Artificial Intelligence. Ease of learning is our key focus. So, all our courses are tailored specifically for beginners.
Although Python is the main programming language we use to instruct these courses, there are some R versions as well. Visit us on our website for written tutorials and course content.

Browse all courses by on Coursemarks.

8.3

CourseMarks Score®

8.2

Freshness

8.4

Feedback

7.8

Content

Platform: Udemy
Video: 3h 39m
Language: English
Next start: On Demand

Students are also interested in

Review widget (for course creators):

Plotting with Seaborn for Beginners in Data Science rating
Code for the widget (just copy and paste it to your site):
<a href="https://coursemarks.com/course/plotting-with-seaborn-for-beginners-in-data-science/" target="_blank" title="Plotting with Seaborn for Beginners in Data Science on Coursemarks.com"><img border="0" src="https://coursemarks.com/widget/83.svg" width="200px" alt="Plotting with Seaborn for Beginners in Data Science rating"/></a>