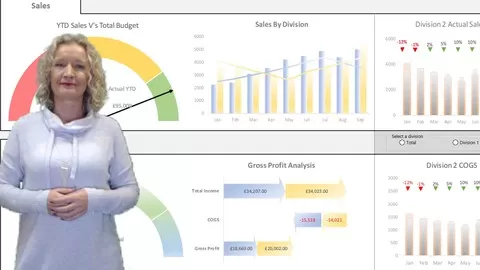
Do you want to improve your charting and visualization skills in Excel? Do you want to master the common and lesser well-known charts available in your spreadsheets? Would you like to be able to create non-standard visually effective Excel charts and interactive dashboards that will all KPI’s to be tracked, help aid business decisions, and reveal insights from your data? If so then this course is the course for you. Excel is not only an awesome tool for storing data and carrying out calculations, but it is also an amazing visualization tool from which you can design and create interactive dynamic dashboards and we are here to show you how it all works.
We will start this course by looking at the basics of charting in Excel. You will explore ways to insert charts and formatting options. After this, we will take a deep dive into creating the most commonly used charts such as line charts, pies charts, and columns charts. And we will then finish the basics by looking at less common charts.
Once we have mastered the basics, you will then learn how to create dynamic non-standard visually effective charts and visualization. You will learn advanced use functions and formulas to drive interaction and by the end of this course, you will be comfortable taking on a dashboard project from scratch.
This is a hands-on course, with workbooks to download and a lot to practice and master, giving you Excel dashboard skills that are in high demand in this growing world of data.
Courses » Office Productivity » Microsoft » Data Visualization » Mastering Excel Dashboard Creation and Data Visualizations
Disclosure: when you buy through links on our site, we may earn an affiliate commission.
Mastering Excel Dashboard Creation and Data Visualizations
Learn to create stunning visually effective dashboards that aid quick business decisions, track KPIs and reveal insights
Created by
8.8
CourseMarks Score®
Freshness
Feedback
Content
Top Data Visualization courses:
Detailed Analysis
CourseMarks Score®
CourseMarks Score® helps students to find the best classes. We aggregate 18 factors, including freshness, student feedback and content diversity.
Freshness Score
Course content can become outdated quite quickly. After analysing 71,530 courses, we found that the highest rated courses are updated every year. If a course has not been updated for more than 2 years, you should carefully evaluate the course before enrolling.
Student Feedback
New courses are hard to evaluate because there are no or just a few student ratings, but Student Feedback Score helps you find great courses even with fewer reviews.
Content Score
The top online course contains a detailed description of the course, what you will learn and also a detailed description about the instructor.
Tests, exercises, articles and other resources help students to better understand and deepen their understanding of the topic.
This course contains:
Table of contents
Description
You will learn
✓ Learn to create eye catching dynamic non standard Excel Charts
✓ Learn to create interactive dashboards with no coding or VBA
✓ Learn to create dashboard that track KPI’s
✓ Learn to create dashboards that aid business decision and help revile insights
✓ Learn tips and tricks for approaching an Excel Dashboard project
✓ Get ideas on good and bad charting and dashboard designs
Requirements
• You must want to learn Excel Charting, Visualizations and Dashboard creation
This course is for
• Those that want to explore the use of Visualizations in Excel
• Those that want to learn to create stunning charts
• Those that want to learn how to create basic interactive Dashboards
• Those that want to learn to create advanced Excel Dashboards
• Students looking for an engaging, hands-on, and interactive course
• Those looking to skill up in Excel in an area where the skills are in high demand
How much does the Mastering Excel Dashboard Creation and Data Visualizations course cost? Is it worth it?
Does the Mastering Excel Dashboard Creation and Data Visualizations course have a money back guarantee or refund policy?
Are there any SCHOLARSHIPS for this course?
Who is the instructor? Is Paula Guilfoyle CPA & MVP a SCAM or a TRUSTED instructor?
In 2020 Paula was awarded with a Microsoft MVP award for her dedication to Excel and the Excel community.
8.8
CourseMarks Score®
Freshness
Feedback
Content

